
Think tank’s research analyzes latest rates of voter registration, turnout in all 95 counties and demonstrates need to increase both in specific urban and rural communities
NASHVILLE – A new fact sheet released today by ThinkTennessee finds that Tennessee trails most other states on both voter registration and voter turnout rates.
Using voter registration data from the secretary of state and average voter turnout rates from the last three presidential election cycles for every county, the fact sheet identifies opportunities to increase civic engagement in both urban and rural communities. The report also includes a data table set detailing the average turnout rates and voter registration rates in each of Tennessee’s 95 counties.
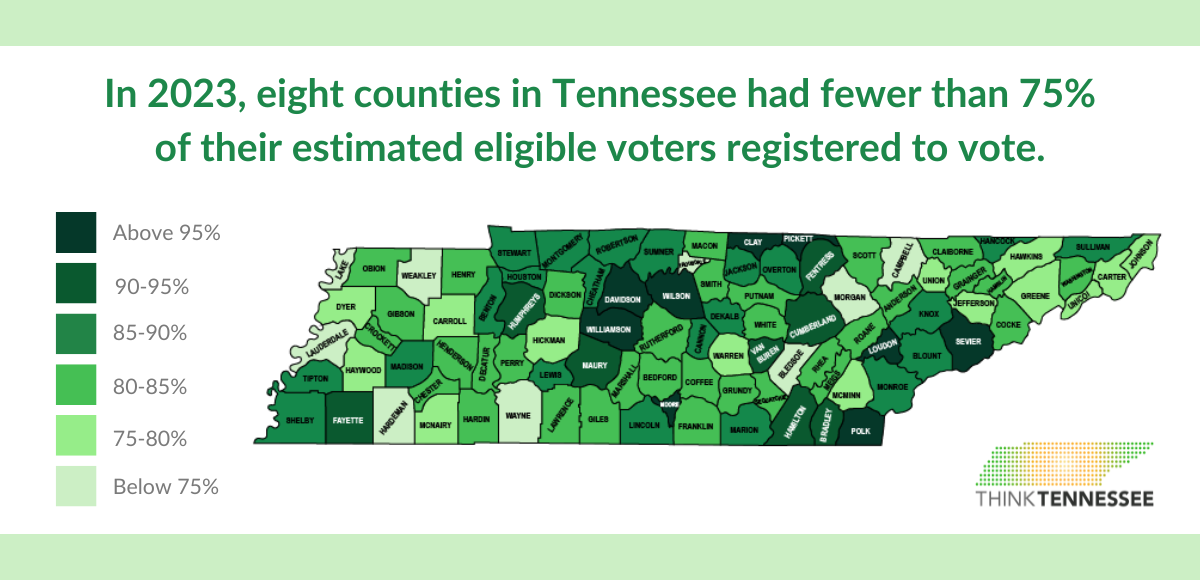
“In 2020, the average voter in America was nearly 5% more likely to register to vote and over 13% more likely to turnout and cast a ballot than a voter in Tennessee,” said ThinkTennessee President Erin Hafkenschiel. “We can–and we must–do better, and our new fact sheet points to promising places to start. For instance, we need more civic investment in our rural communities, where eight counties have a voter registration rate of less than 75%. We also need a greater focus on ensuring civic resources and information are reaching voters in our most populous urban counties, where we have the greatest total number of unregistered voters.”
In a comparison of voter registration and turnout rates, Tennessee consistently trails almost all other states in the country in both presidential and midterm election cycles. Most recently, in November 2022, Tennessee was 42nd in registration and 51st—dead last—in turnout. Even when Tennessee broke state records for voter turnout in 2020, the state still ranked 47th nationally and far behind neighboring states.
Key Findings
Voter Registration
- Rural areas have the most potential for growth in registration rates as a percentage of their citizen voting-age population, while major cities and their surrounding areas have the largest estimated number of unregistered Tennesseans.
- In 2023, more than half of Tennessee’s 95 counties (53) had a voter registration rate below the 2022 national average (84.4%).
- In eight counties, all rural, fewer than 75% of the estimated eligible voters were registered, including Lake (56.9%), Trousdale (66.4%), Lauderdale (67.5%), and Morgan (68.2%).
- While more populous counties tend to have higher voter registration rates, they also have the largest numbers of unregistered residents. As of 2023, there are an estimated 156,000 unregistered residents in Davidson, Shelby, Knox, and Hamilton counties.
Voter Turnout
- Voter turnout rates can increase the most in rural counties. Fewer than 60% of registered voters cast a recent presidential ballot in 22 counties, with six (Hancock, Clay, Scott, Campbell, Lake, and Perry) averaging less than 55%.
- High registration rates do not necessarily result in high voter turnout rates. Rural Polk, Clay, and Sevier counties have a voter registration rate over 88% but fewer than 60% of registered voters cast recent ballots. Similarly, counties with the “Big 4” cities (Davidson, Knox, Hamilton, Shelby) have registration rates above 85%, but none averaged above 65% turnout.

