State of Our State
How Does Tennessee Stack Up?
ThinkTennessee’s State of Our State dashboard, now in its 6th year, provides a snapshot of how our state ranks nationally across 135 of the indicators that matter most to Tennesseans.
The Tennessee economy is rapidly expanding. But to date, our economic success has not yet translated into greater economic opportunity and security for all Tennesseans.
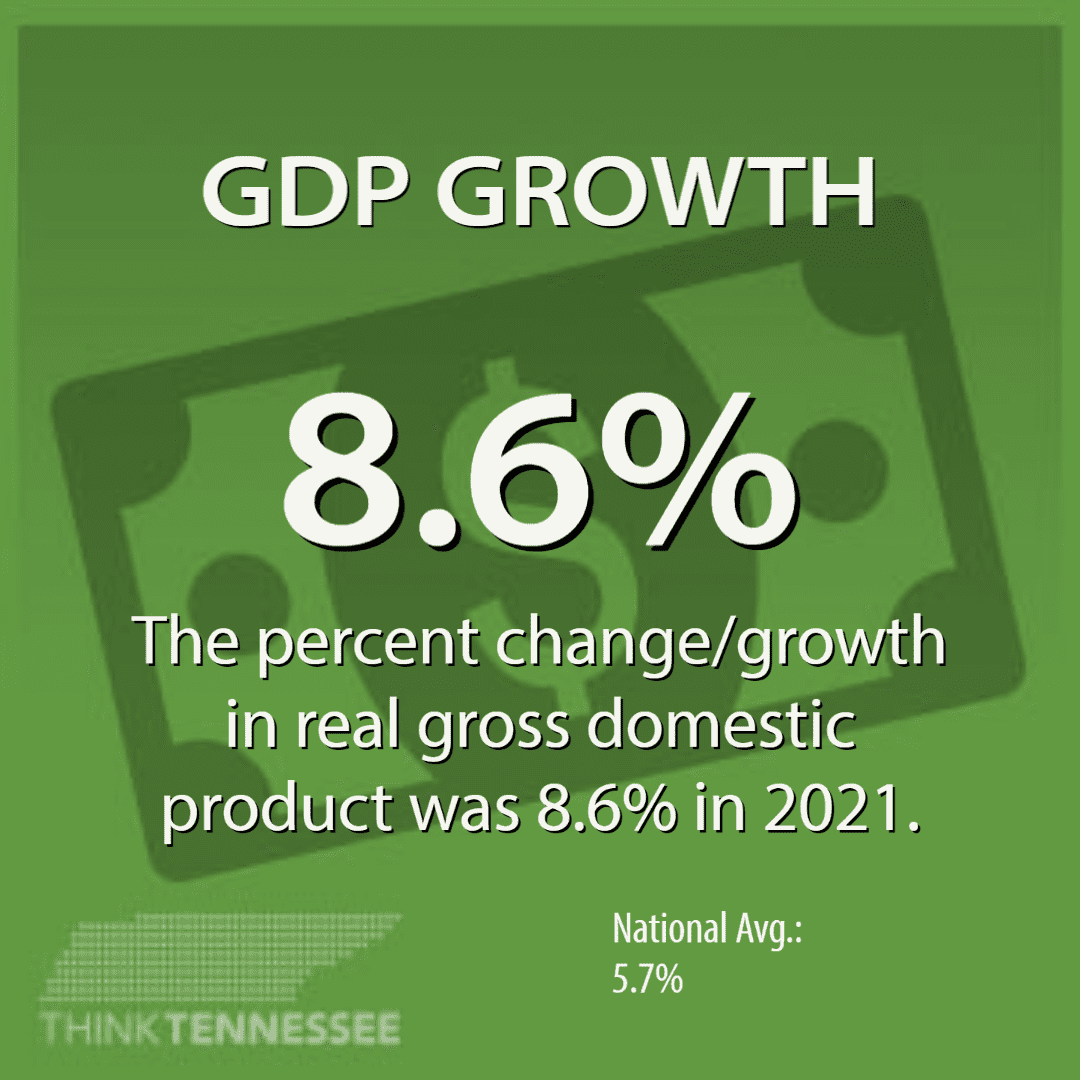
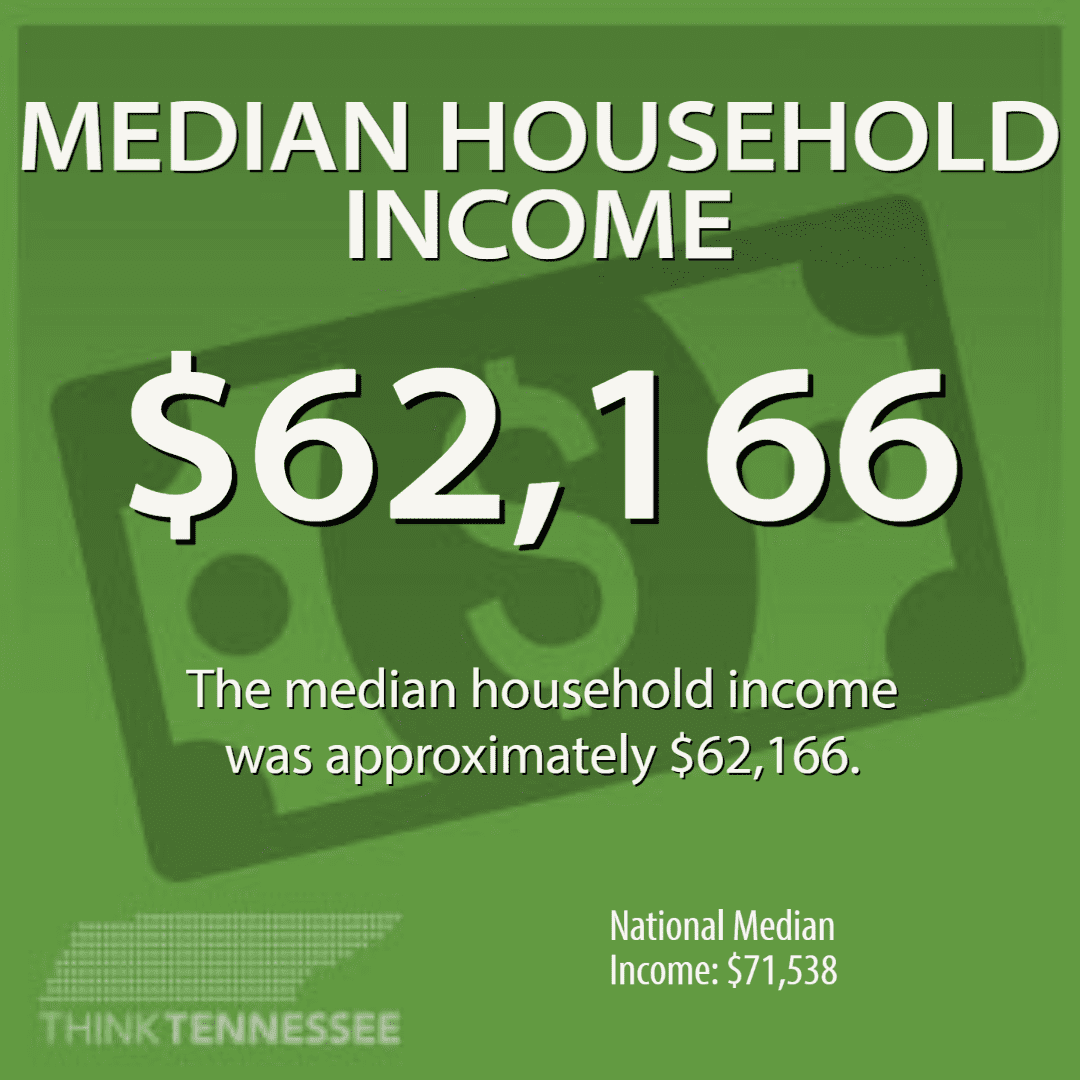
Indeed, while our latest dashboard finds improvements in our national rank on statewide economic indicators from GDP growth (in just three years we’ve risen from #24 in the country to #1–a rate of 8.6% in 2021!) to poverty to unemployment, metrics at the individual level, including median household income, debt levels, and cost-burdened households among others have declined or worsened.
Importantly, state-level economic successes did not happen by accident. Rather, the improvement in these metrics is a direct result of concerted statewide policy efforts and prioritization – illuminating a path forward to achieve similar progress on many of the affordability, infrastructure, and health challenges continuing to plague our state’s working families.
As Tennessee moves deeper into this period of economic expansion, the 2023 dashboard points to several areas where the scope of policymaking should prioritize expanding access to opportunities for all Tennesseans.
Interested in ideas about how to move our state forward? Our research shares success stories from other states and includes pragmatic solutions about how Tennessee can continue to make progress.
Note: For the sake of consistency, rankings have been standardized so low numbers always reflect positive outcomes. In other words, being ranked first is always better than being ranked 50th. Additional detail on research methodology can be found below the rankings.

")

Notes on Methodology:
Metrics were compiled using publicly available data and are current as of Jan. 10th, 2023. Where possible, we favored U.S. government data over other sources for consistency and reliability.
Some debt- and voting-related indicators will be updated throughout the year as newer information becomes available.