Tennesseans will once again head to the polls for a general election in a presidential cycle this November 5th. The last time we voted for president in November 2020, we broke state records with the most registered voters in state history turning out to cast their ballots. Not only that, but every county in the state saw voter turnout increase over their 2016 rates.
Looking at turnout of registered voters in presidential cycles dating back to 1996, we find that this is the first time turnout increased statewide between two presidential cycles. Historical data also show that Tennessee voter turnout in presidential elections has trended positive over time, despite lower turnout in 2012 and 2016.
Key Findings:
- In November 2020, voter turnout increased over the previous presidential election cycle (2016) in every Tennessee county for the first time in at least two decades.
- Voter turnout in presidential elections has shown overall positive trends, both statewide and at the county level.
 The 2020 presidential election was a standout year for voter turnout, with a record number of registered Tennessee voters casting ballots.
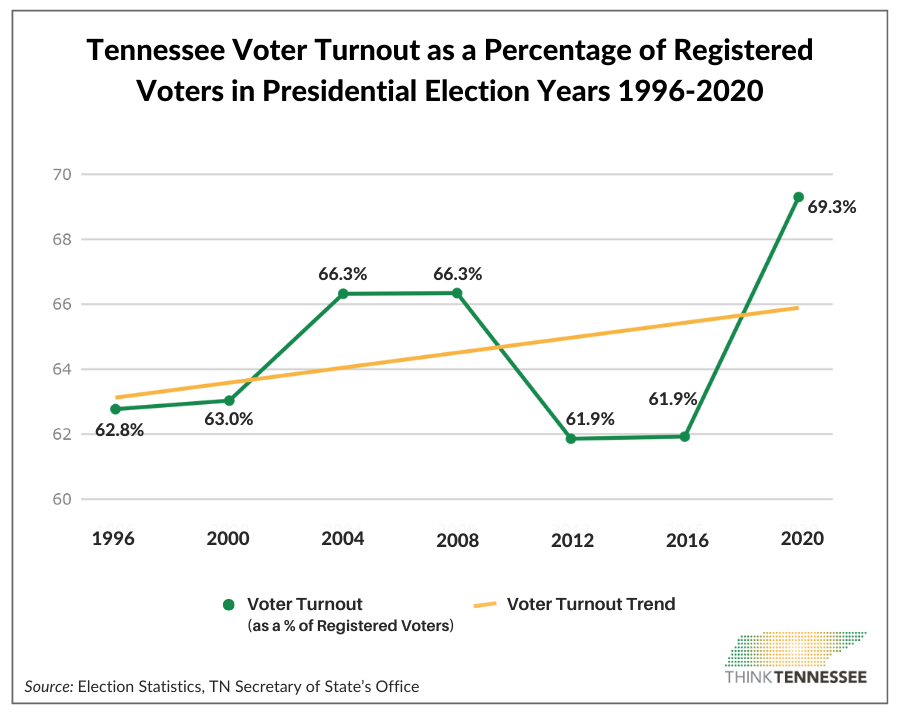
In the six presidential election cycles prior to 2020, voter turnout among registered Tennessee voters averaged 63.7%. But in 2020, voters showed up more than ever before, with 69.3% casting ballots, overcoming challenges of the pandemic.[1]
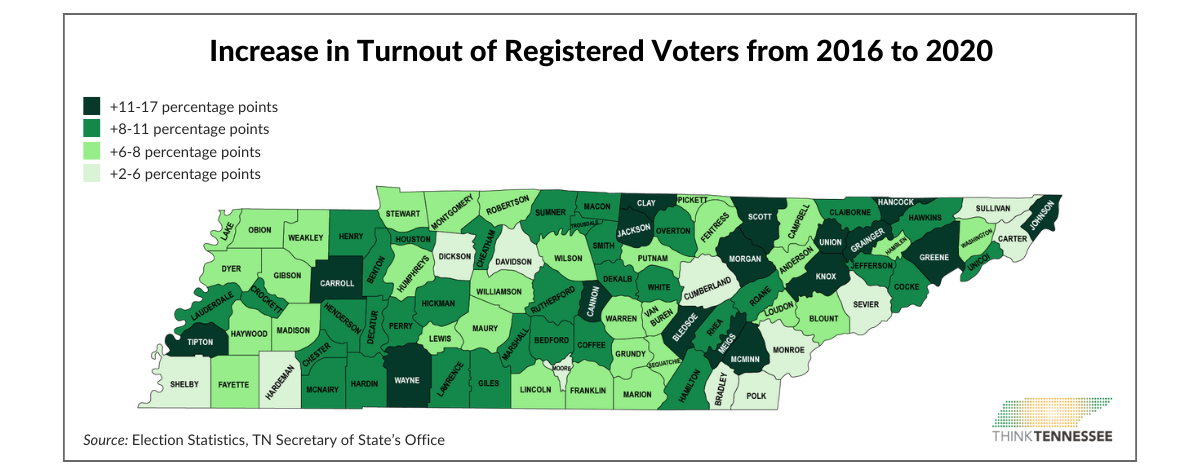
Driving that turnout increase, every Tennessee county saw higher turnout in 2020 than in 2016 —ranging from a low of 2.9 percentage points in Davidson County to more than 15 percentage points in Morgan, Hancock, and Grainger counties.
This is the only time in recent history that voter turnout increased from one presidential cycle to the next in all 95 Tennessee counties.
 For the first time, all 95 counties experienced an increase in voter turnout from one presidential cycle to the next from 2016 to 2020.
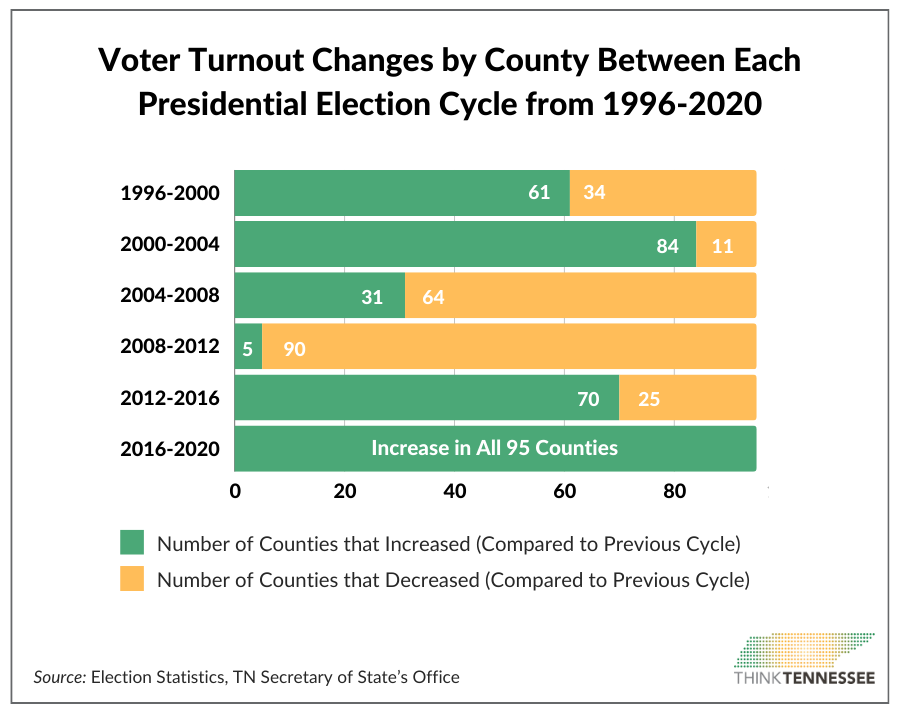
Historically, the majority of Tennessee counties have seen voter turnout increase from one presidential election to the next – with the exception of two cycles.
From 2004 to 2008, more counties saw turnout decrease (64) than increase (31), resulting in statewide turnout levels staying mostly consistent.[2] And from 2008 to 2012 when statewide turnout dropped 4.4 percentage points, only five counties saw turnout levels increase.[3]
Tennessee statewide voter turnout in presidential elections has trended positive over time, despite lower turnout in 2012 and 2016.
Historical county-level data show two additional positive trends in voter turnout:
- Voter turnout increased in both of the last two cycles (2012 to 2016 and 2016 to 2020) in nearly three-quarters of the state (73.7% of counties). Three counties—Bledsoe, Crockett, and Grundy—have seen turnout increases over three cycles.[4]
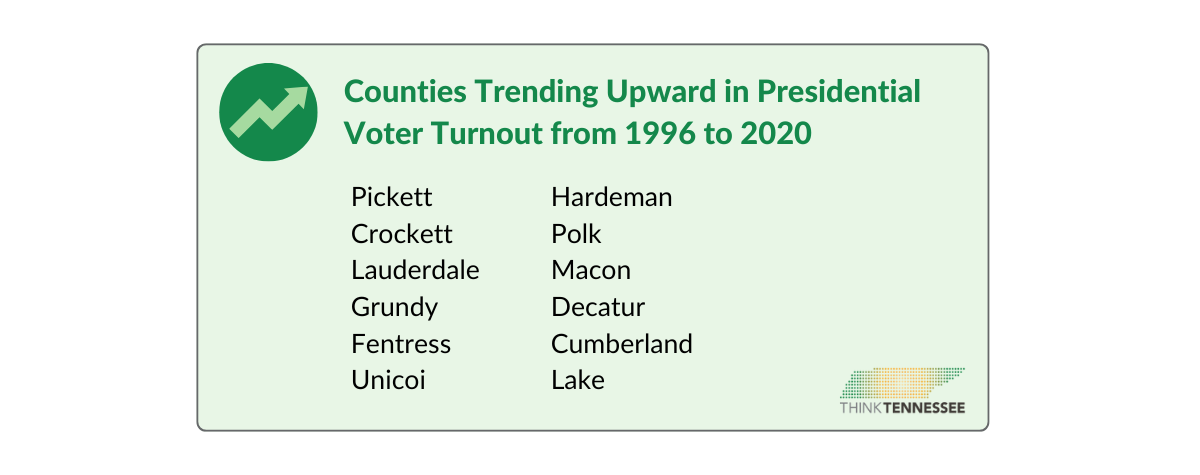
- Voter turnout rates have an overall positive trend over the last six presidential election cycles from 1996 to 2020 in 12 counties.[5]
Tennessee voters will have more choices on the ballot this year, potentially continuing to drive increased turnout.
This November, more Tennessee voters will have choices on the ballot than in recent cycles, with significantly more state legislative races (62.6%) featuring at least two candidates (one from each major party), up from less than half, 40.9%, in 2020 (and 37.9% in 2022).
With just 52 days until the November 5th general election, we’ll see soon if that helps drive more Tennesseans to the polls this year.
Remember, get registered (or check your registration status) by October 7th and make a plan to vote absentee (request by October 29th), early (October 16th-31st), or on Election Day on November 5th!
Check out our 2024 Voter Education Series if you have any other questions on how to register and participate.
_________________________________________________________________
FOOTNOTES
[1] Voters embraced Early Voting and Absentee By-Mail in 2020, with 74.9% of ballots cast before Election Day (67.4% during Early Voting and 7.5% Absentee By-Mail). While it’s typical for over half of voters to cast ballots early in-person, a much larger share voted by mail in 2020. From 2000-2016, an average of 2.4% of voters cast absentee ballots; in 2020, 7.5% chose absentee—a percent change increase of 212.5%.
[2] On average across all counties, voter turnout dropped by 2.1 percentage points from 2004 to 2008, with many counties experiencing only small increases or decreases.
[3] The five counties that increased in voter turnout from 2008-2012 (despite all others decreasing) were Bledsoe, Chester, Grundy, Shelby, and Crockett.
[4] Bledsoe’s voter turnout among registered voters grew from 41.8% in 2008, to 51.9% in 2012, to 57.4% in 2016, to 68.9% in 2020. Similar trends occurred in Crockett (from 60.9% in 2008 to 62.1% in 2012, to 64.3% in 2016, up to 73.2% in 2020) and Grundy (from 55.9% in 2008, to 60.0% in 2012, to 62.3% in 2016, up to 70.4% in 2020).
[5] While each of these counties have experienced fluctuations in turnout between election years (i.e. they each decreased in one out of the last six cycles), over time they have an upward slope in turnout. The 12 counties are: Pickett, Crockett, Lauderdale, Grundy, Fentress, Unicoi, Hardeman, Polk, Macon, Decatur, Cumberland, and Lake.